Setting up Splunk Forwarder
Installing and configure Splunk Forwarder
Splunk Forwarder is an one of the component of Splunk Infrastructure, that acts as an agent to collect data from remote machine, then forward it to Indexer for further processing and storage.
Splunk Forwarder has very small footprint on hardware resources, where it takes only 1 -2% of CPU. Also It provides reliable, secure data collection from remote machines for indexing and consolidation for Search Head to access the data. All this is done with a minimal impact on system performance, while client machine is running other programs.
There are two types of Splunk Forwarders
- Universal Forwarder - Contains only the components that are necessary to forward data.
- Heavy Forwarder - Full Splunk Enterprise instance that can index, search, and change data as well as forward it.
Comparison table of Universal Forwarder and Heavy Forwarder from Official Splunk Website.
Splunk can transfer data in three different types
- Raw
- Unparsed
- Parsed
Raw data - the forwarder sends unaltered data over TCP stream, It doesn't convert data into Splunk Communication format. This is particularly useful for sending data to non-Splunk system.
Unparsed data - A universal forwarder perform minimal processing to tag the data stream with metadata to identify source, source type, and host (these are also known as "keys"). Also these data are divided into 64-killobyte blocks, then gets timestamped, If it is not already available.
Parsed data - A heavy forwarder breaks data into individual event, then examine to annotate with key value pair, that may be different in each induvial events.
Both unparsed and parsed data known as Cooked data. By default forwarder send cooked data. Universal forwarder sends unparsed data, and heavy forwarder send parsed data. This can be amended in outputs.conf by setting sendCookedData=false to sent raw data, If needed.
Configuring Splunk to collect and forward logs
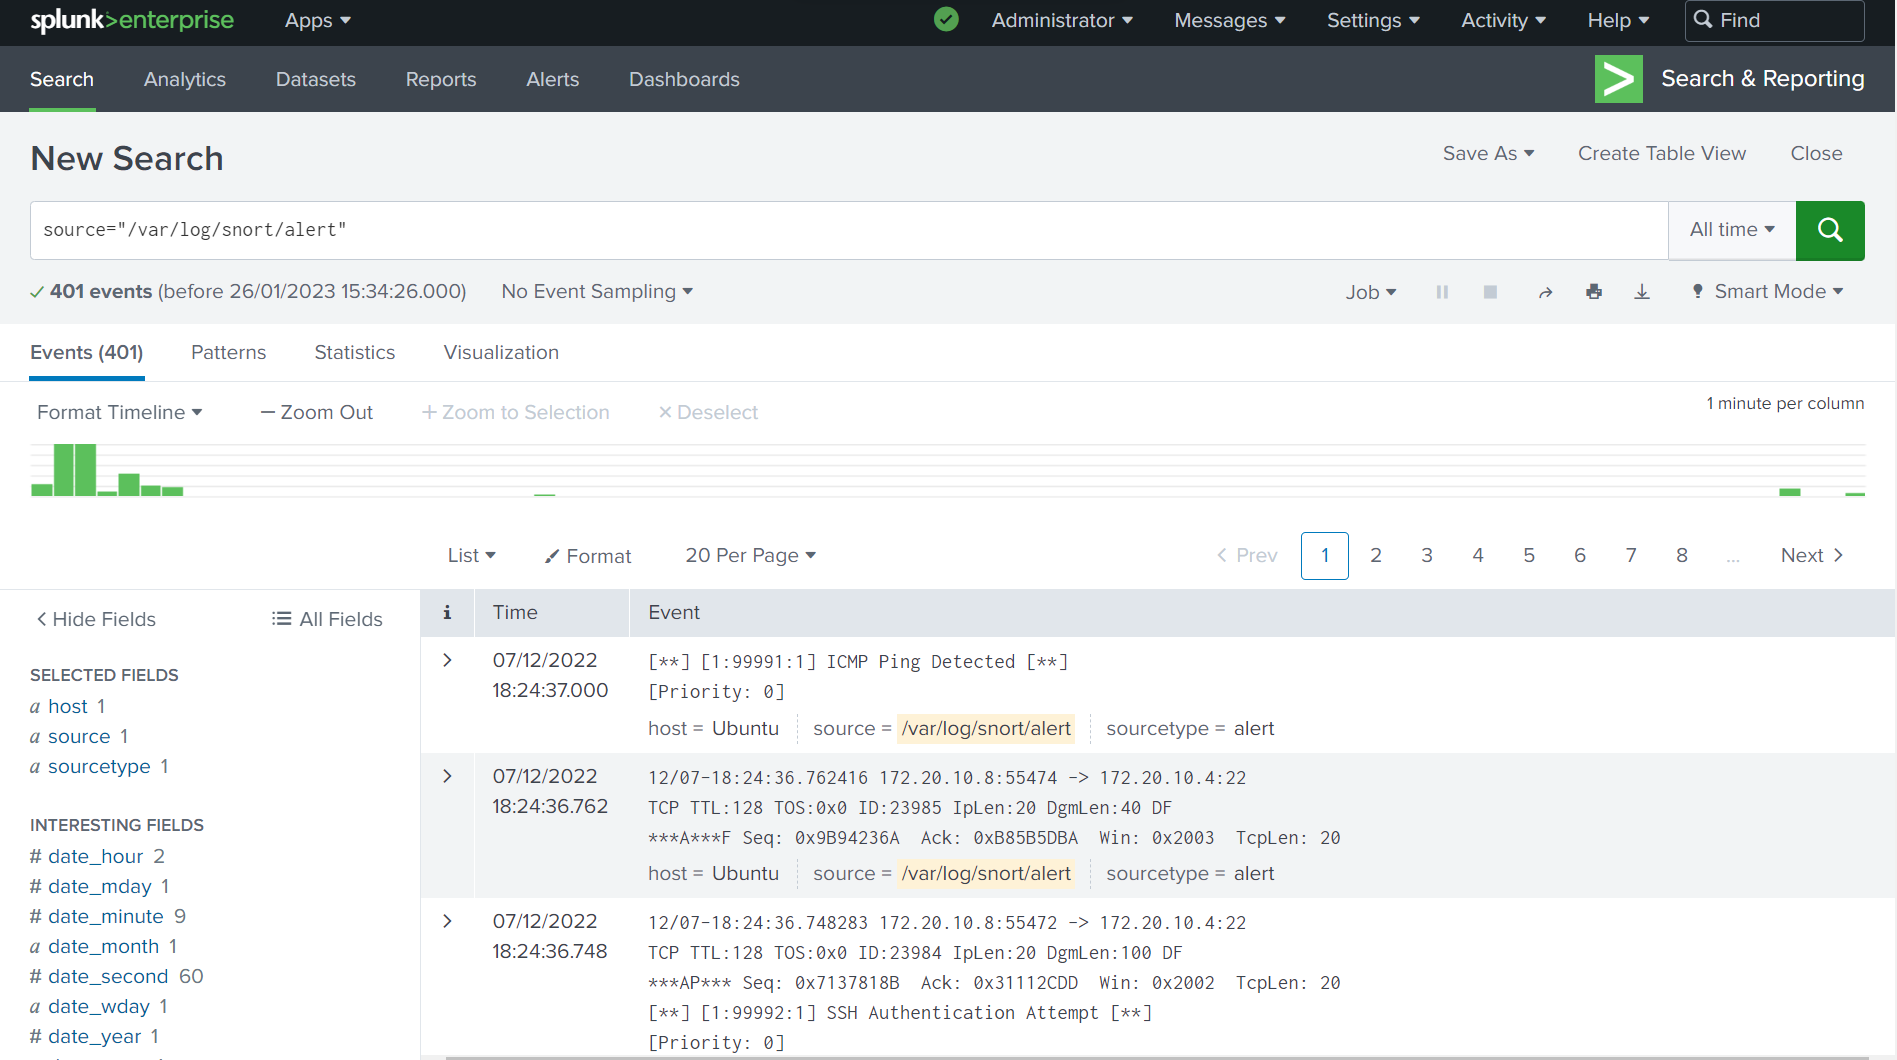
We will be using the data we have gathered using Snort IDS and forwarding to Splunk Search Head.
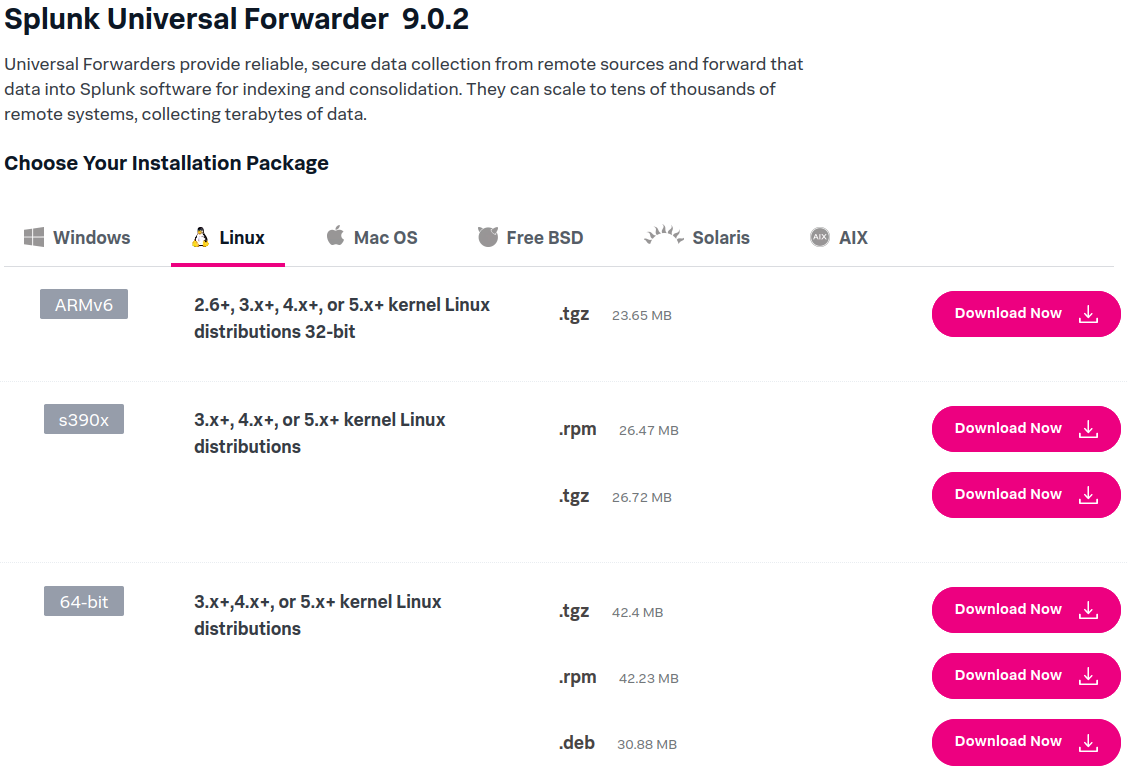
- Download Splunk Forwarder Debian from official website
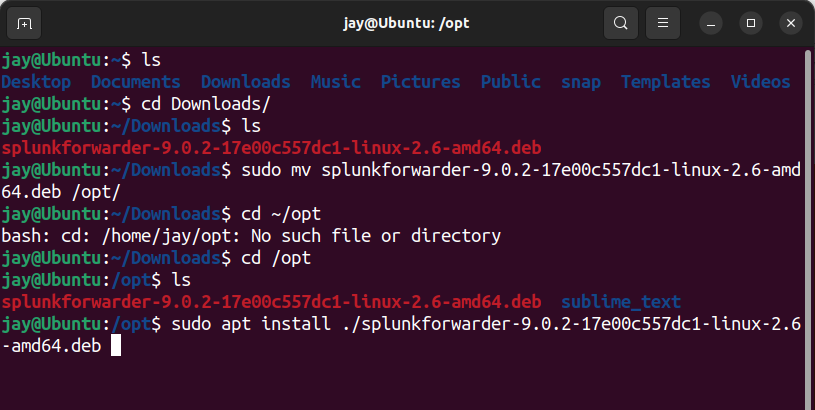
- Move the downloaded file to
/optoptional software package directory - Navigate to
/optdirectory, then install the package by enteringsudo apt install ./splunkforwarder -x.x.x-xxx.. - Start the Splunk Forwarder by navigating to
/opt/splunkforwarder/bin, then runsudo ./splunk start -- accept-license. This will start the Splunk Demon - Enable Auto-boot on start up, so the Splunk will automatically starts at boot up
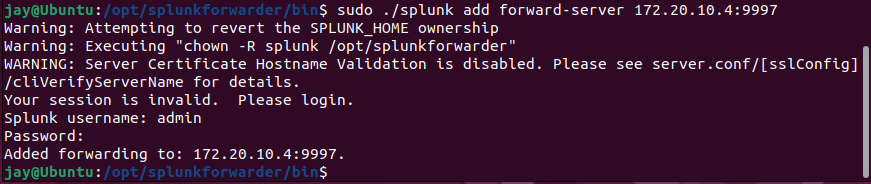
/opt/splunkforwarder/bin/splunk enable boot-start - Forward the data to Splunk server by entering
sudo ./splunk add forward-server <Splunk Server IP-Address>:9997 - Navigate to
opt/splunkforwarder/etc/system/localdirectory, then check the configuration onoutputs.conffile. Ensure that the server and tcpout-server are configured to correct server. - Then, navigate to
opt/splunkforwarder/bindirectory, then state the file we wanted to monitor by Splunk -sudo ./splunk add monitor /var/log/snort/alert - Change the settings on
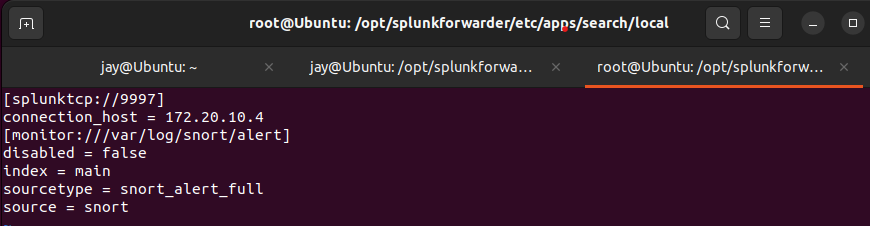
inputs.conffile in/opt/splunkforwarder/etc/apps/search/localas shown below.
local folder. Get root permission by su root or su - command. 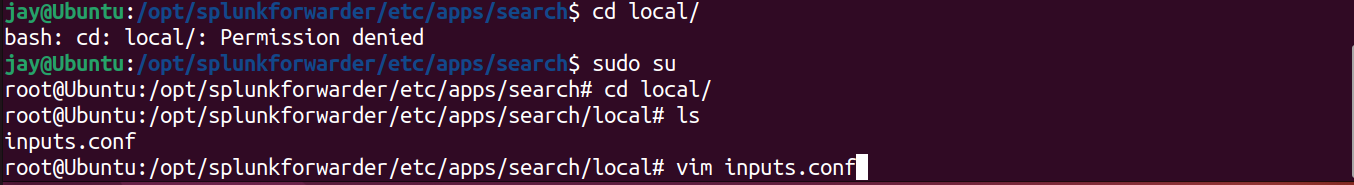

inputs.conf file as shown hereThe screenshot above shows the settings of data forward to the server
- TCP Port - Default port <9997>
- Server - 172.20.10.4 (Yours may differ)
- Data file -
/var/log/snort/alertfile (log) - index - Name given to data
- source type - Tells Splunk what type of data
- Source - Where the data is coming from
9. Once the inputs.conf file has been edited in /local/ folder, we can change back to normal user by su <user>
10. Then, navigate to /opt/splunkforwarder/bin/ then entre sudo ./splunk restart to reboot Splunk Forwarder
11. Add new receiving port under Forward and receiving on Settings.
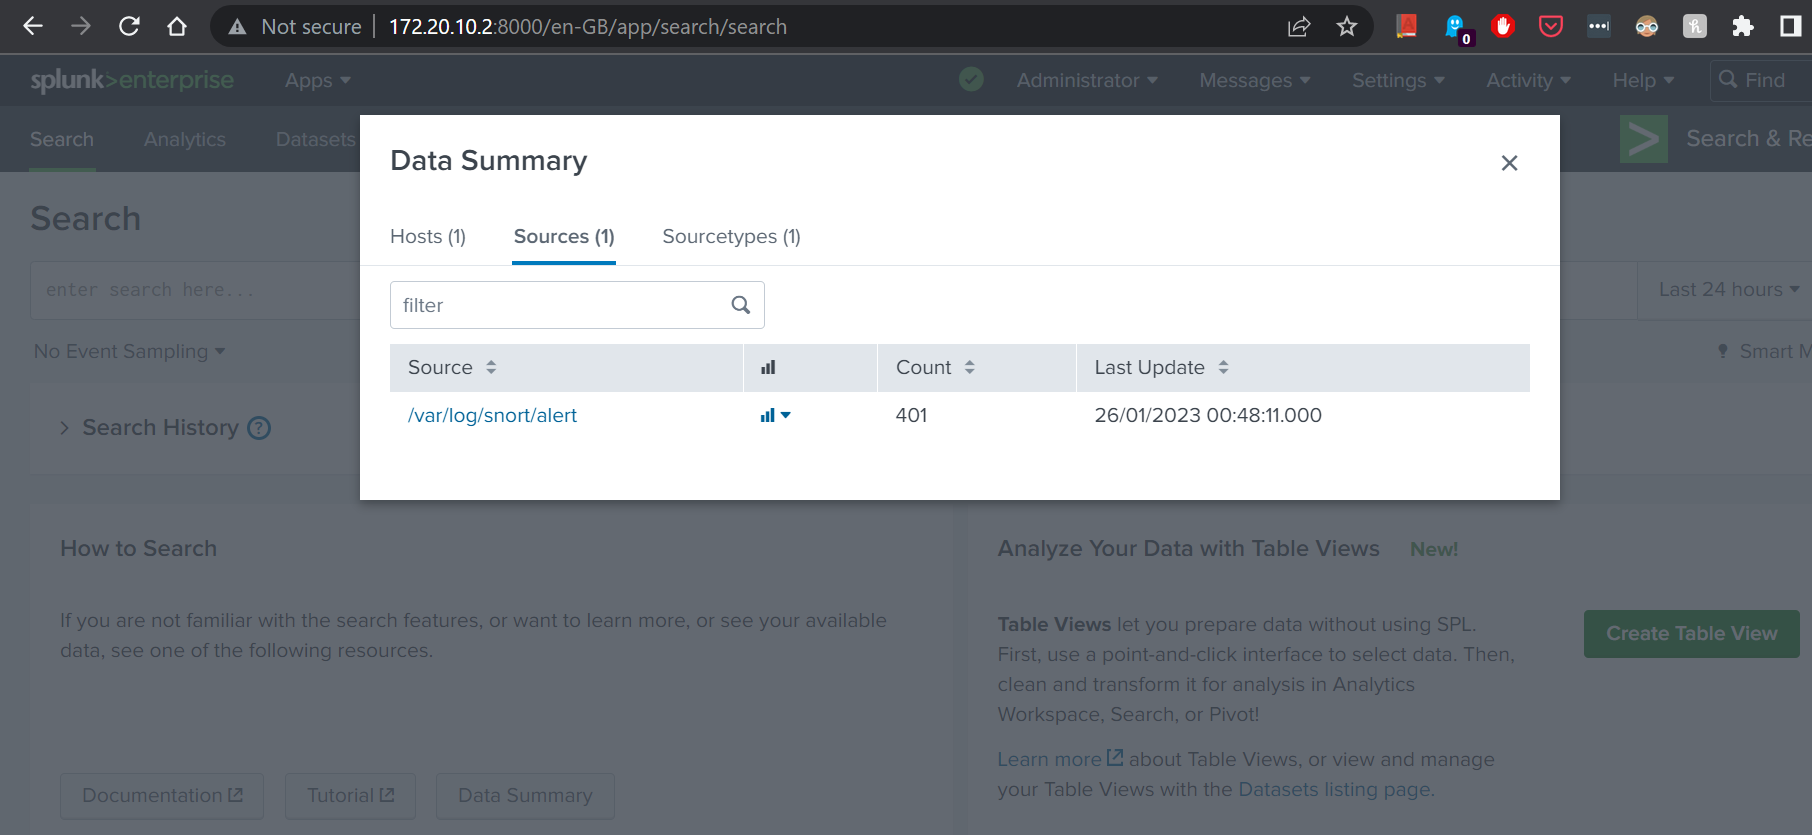
12. Once the Splunk Forwarder has restarted, we can log into Web Portal and check the indexed data.
Visual Guide : Configuring Splunk Forwarder
/opt/ folder, then install Splunk Forwarder.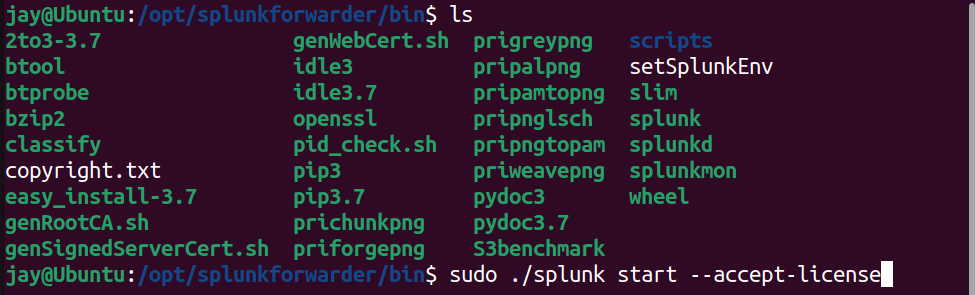
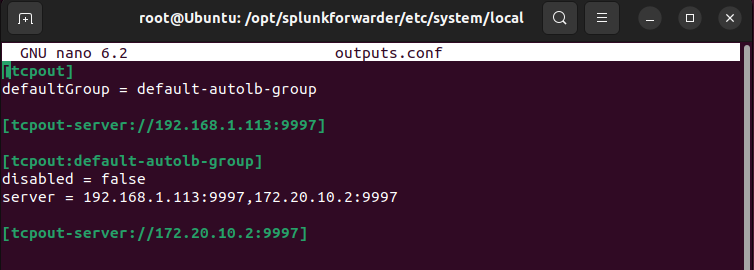
outputs.conf file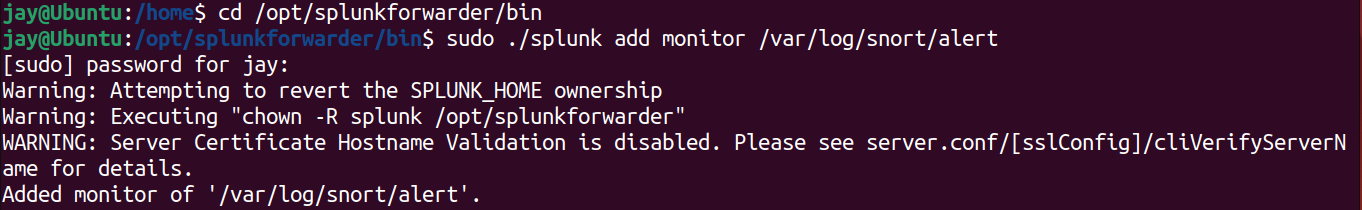
inputs.conf file as above in /opt/splunkforwarder/etc/apps/search/local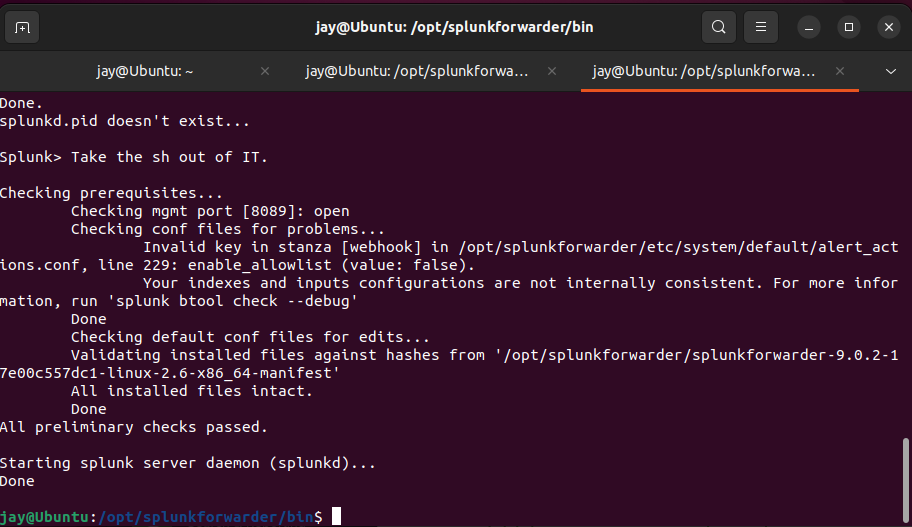
sudo ./splunk restart command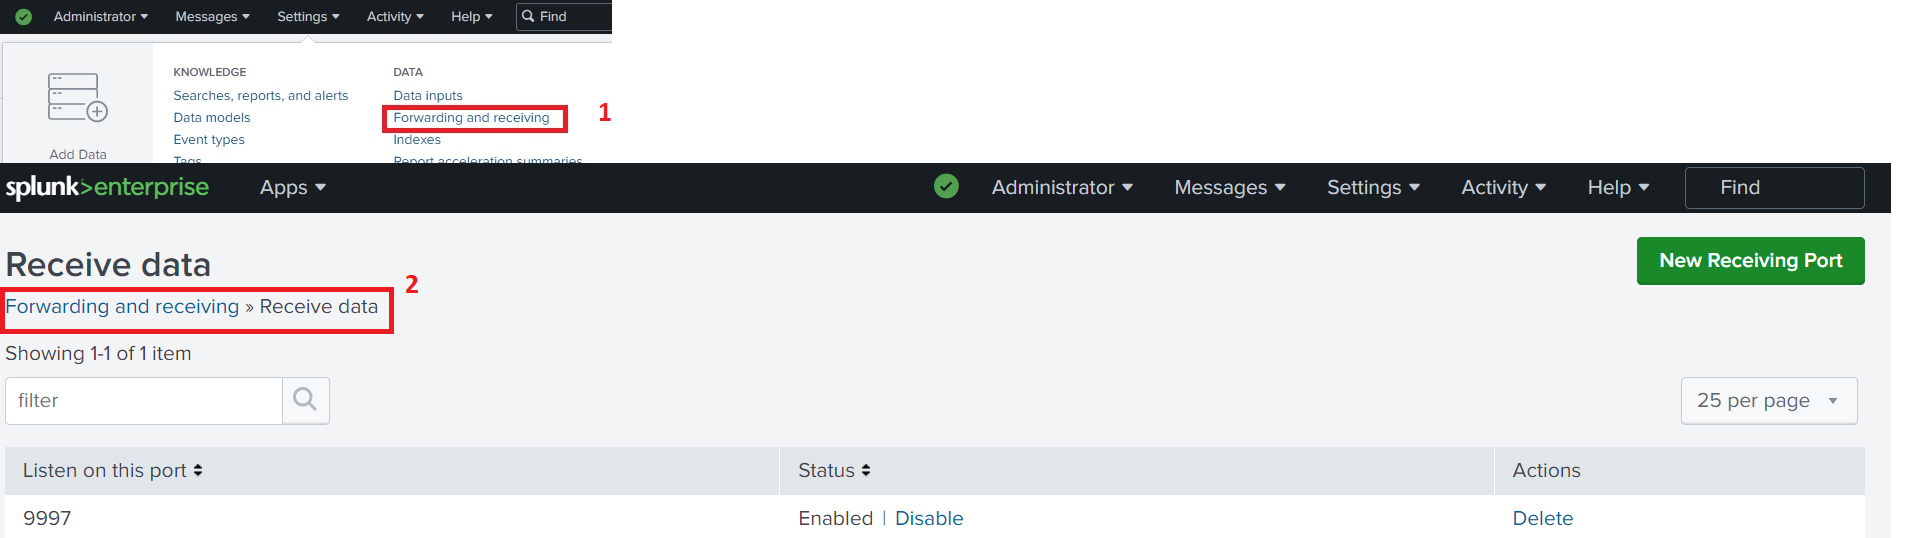
We have looked at how we can forward Snort log data from previous article. In future articles, we will be looking at how we can extract data from ingested log file, and how we can analyse, visualise and measure the data we have gathered.
Member discussion